What is SPAC-Analytics?
Plant-Ditech’s SPAC (Soil-Plant-Atmosphere-Continuum) Analytics is cloud-based software that performs real-time statistics, analysis and productivity prediction.
SPAC-Analytics enables agro-researchers to process input from multiple sensors and sources, providing statistical and graphical representations of correlations among various growth and productivity traits, along with environmental parameters.
The software allows you to run real-time multiple analysis during and following the experiment, using huge amounts of real-time data that are impossible to process manually.
The SPAC-Analytics software is a complementary product to the PlantArray, a high-throughput plant phenotyping equipment
All the data is retrieved automatically and continuously from large arrays of plant samples over any period of a growth cycle.
Key benefits
SPAC-Analytics provides comprehensive tools to optimize plant growth and resource efficiency by analyzing soil-plant-atmosphere interactions. Key benefits include:
- Dynamic WUE Measurement: Real-time insights into water use efficiency, supporting sustainable practices.
- Advanced Plant Physiology Data: Holistic tracking of growth and stress responses, aiding resilient crop development.
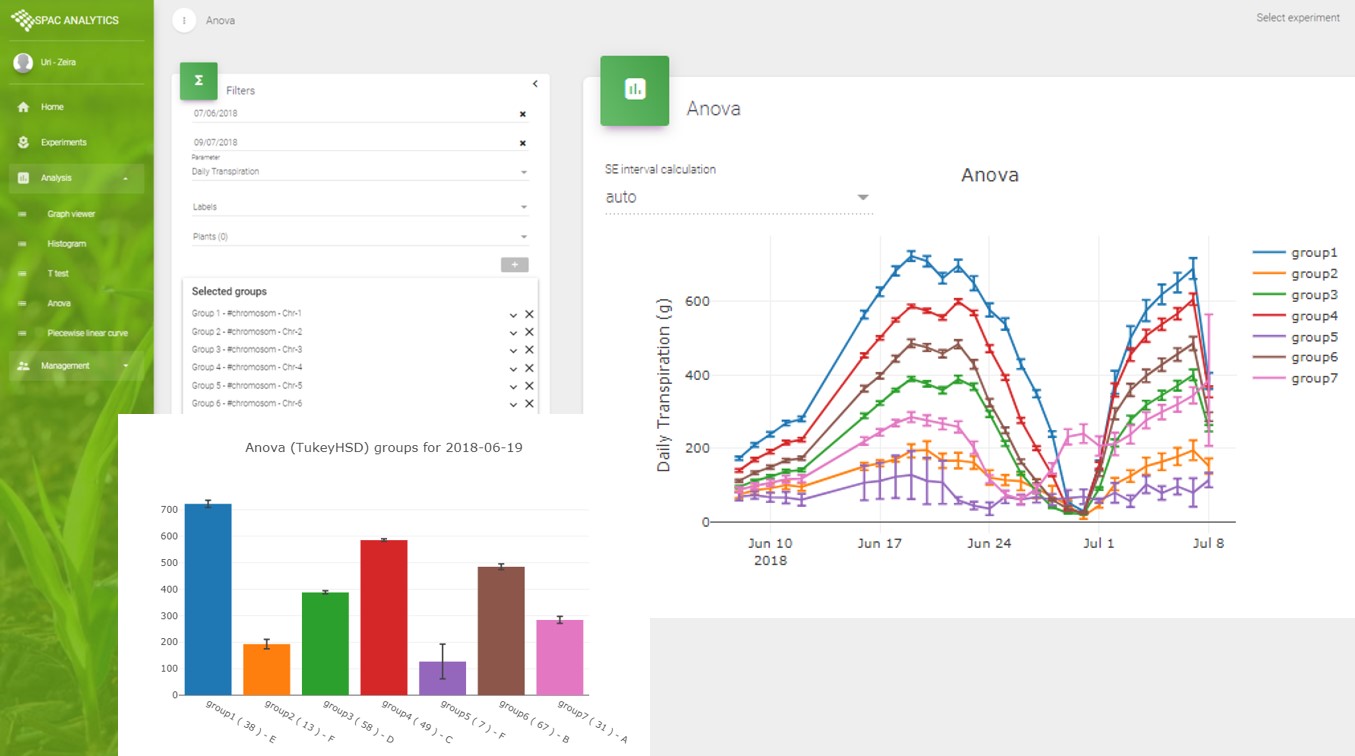
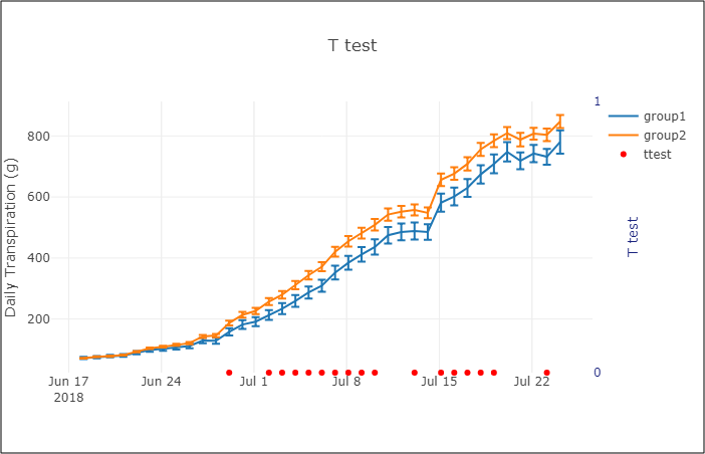
- Real-Time Statistical Analysis: Fast, reliable results with ANOVA and T-tests to fine-tune experiments on the go.
- Performance Profiling: Quick quantitative ratings of plant responses to environmental factors.
- Clear Data Visualization: Graphical tools reveal trends, anomalies, and correlations for actionable insights.
- Customizable & Scalable: Adaptable to any study size, for targeted or broad research applications.
Analytical capabilities of SPAC-Analytics
The system processes and presents correlations, both numerically and graphically, between values, sensitivities, anomalies and ratios in the relationship between the following measures and imposed conditions:
- Smoothed time series of the measured parameters (weight, soil water content, atmospheric water demand, etc.).
- The rate of change of the above-mentioned parameters over time.
- Plants biomass gain along different time intervals (days, weeks, and season).
- The pattern of daily transpiration.
- The water use efficiency (WUE) along different time intervals (days, weeks, and season).
- Soil water content (either by mass balance calculation or direct measurement by a specific sensor).
- Stomatal conductance variation along the hours of the day.
- Influx from the soil to the roots (when soil sensors are installed).
- The variation of the plant’s relative water content during the day hours.
Empowering plant research with SPAC-Analytics APIs
For breeders, plant physiologists, and environmental researchers, SPAC-Analytics APIs enable access to plant data, enhancing analysis and integrating external datasets directly into SPAC-Analytics.
How SPAC-Analytics APIs will help your research?
- Enrich Your Research with Comprehensive Plant Data: Leverage PlantArray’s extensive database, which includes plant performance metrics, growth patterns, and environmental data. Through our APIs, you can supplement SPAC-Analytics with valuable data for a more comprehensive view of plant dynamics.
- Streamlined Data Automation: Eliminate the need for manual data downloads—our APIs automate data retrieval, allowing SPAC-Analytics to continuously update with the latest plant data for streamlined analysis.
- Integration with SPAC-Analytics: Integrating PlantArray’s data into SPAC-Analytics enhances your analytics platform with real-time, precise data. This integration supports informed decision-making, deeper insights, and a competitive edge in plant research.
- Customizable Data Access: SPAC-Analytics APIs offer versatile endpoints and parameters, enabling tailored data requests to meet your unique research needs and objectives.